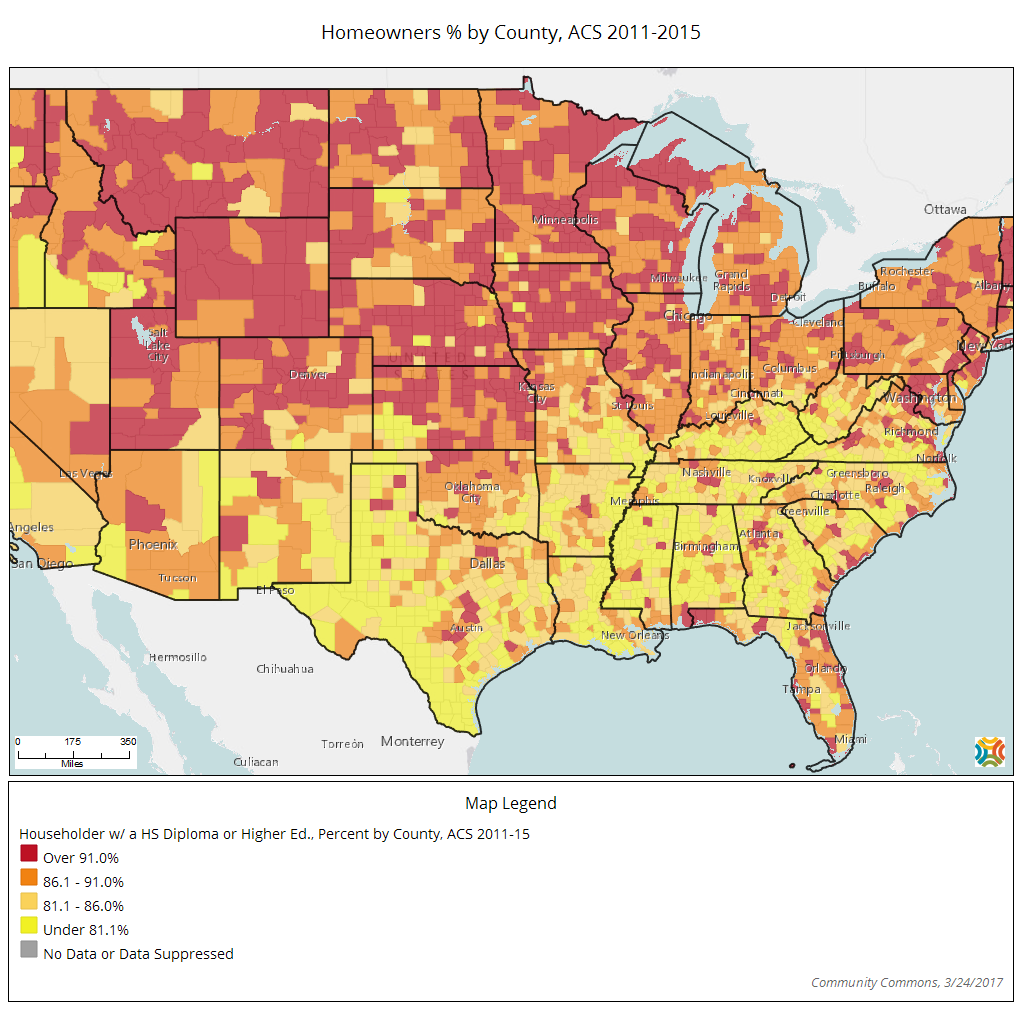
For decades, homeownership rates have been an important indicator of the health of housing markets all across the United States. Communities use these data to recognize the changing landscape of their housing markets by analyzing patterns in the percentage of owner-occupied housing units compared to all occupied units. Homebuilders, financial institutions and realtors all depend on homeownership data to determine what type of housing to build, finance and sell to prospective homebuyers. While last decade’s housing crash and Great Recession altered the economy and conditions of housing markets throughout the nation, studies have shown that most Americans continue to believe homeownership is both desirable and attainable.
Data from the American Community Survey provide the opportunity to learn more about homeownership in America and how it differs between rural and urban areas. With the American Community Survey 5-year data for geographies with populations less than 65,000, homeownership can be analyzed beyond just the nation and regions but also by rurality of a county. For more information about how the U.S. Census Bureau defines urban and rural geographies, see Defining Rural at the U.S. Census Bureau.
According to 2011-2015 American Community Survey data, there were 116.9 million occupied housing units in the nation. Of these occupied housing units, 22.6 million (19.3 percent) were located in rural areas and 94.4 million (80.7 percent) in urban areas.
In general, rural areas in the United States have higher homeownership rates than urban areas. Compared with urban areas, where the homeownership rate was 59.8 percent, rural areas had a homeownership rate of 81.1 percent. In all four regions, the homeownership rate was higher in rural areas than in urban areas. In the Northeast, rural areas had a homeownership rate of 83.8 percent, whereas urban areas had a rate of 58.2 percent. Homeownership rates in rural areas accounted for 83.6 percent in the Midwest and 79.8 percent in the South, while in urban areas it accounted for 63.3 percent and 60.7 percent in those regions, respectively. The West had a homeownership rate of 77.3 percent in rural areas and a rate of 56.7 percent in urban areas.

County level analysis was conducted by categorizing counties into three levels of rurality based on the percentage of the decennial census population living in the rural areas of the county in 2010. The counties were delineated as completely rural (100.0 percent rural), mostly rural (50.0 to 99.9 percent rural) and mostly urban (less than 50.0 percent rural). (See all U.S. counties and their level of rurality here.)
Based on the three levels of rurality for counties, homeownership rates increase as the proportion of the population living in rural areas increases. Both completely rural (76.2 percent) and mostly rural (74.4 percent) counties had higher median homeownership rates than the 68.2 percent in mostly urban counties (there was no statistical difference between the completely rural and mostly rural rates). Similar to national findings, the homeownership rates in completely rural and mostly rural counties in the Midwest, South and West regions were higher than those counties that were mostly urban (again, there was no statistical difference between the completely rural and mostly rural rates). Completely rural counties in the Northeast had homeownership rates higher than both mostly rural and mostly urban counties in that region.
To understand why homeownership rates are higher in rural areas than urban areas, some of the characteristics that have traditionally been indicators of homeownership can be taken into account. The likelihood of owning a house increases as age increases. With a median age for the adult population of 51 in rural areas compared to 45 in urban areas, the adult population in rural areas tend to be older and naturally in stages of life in which owning a house is more likely. Furthermore, householders age 65 or older, an age group that regularly has some of the highest homeownership rates, accounted for 27.7 percent of all households in rural areas and 22.4 percent in urban areas.

Households consisting of married couples are a group that generally has higher homeownership rates compared to non-married households. Nationally, the homeownership rate for married-couple households was 79.8 percent, higher than a homeownership rate of 49.0 percent for non-married households. Married-couple households comprised 58.6 percent of all households in rural areas, higher than the 45.8 percent of households in urban areas. Furthermore, there were a higher proportion of owner-occupied houses owned by married-couple households in rural areas (89.0 percent) than in urban areas (77.0 percent).
Being a homeowner carries a huge financial commitment. Paying a monthly mortgage, utilities, real estate taxes, property insurance and any applicable fees for living in a condominium or mobile home can quickly add up. However, these housing costs were not as high in rural areas as they were in urban areas. In rural areas, the median monthly housing cost for households paying a mortgage was $1,271, lower than the median monthly housing cost of $1,561 in urban areas.

Another interesting fact about owner-occupied households in rural and urban areas is that a higher percentage of housing units were owned “free and clear” in rural areas (44.0 percent) than urban areas (32.3 percent). That is, there was no mortgage or loan on the house. As a result, by not having a mortgage these households have lower monthly housing costs which frees up more financial resources for discretionary use.
Understanding our changing population and housing stock is important to the well-being of all American communities. The American Community Survey is the only data source that gives all areas, whether they are big or small, rural or urban, the ability to better plan and address local housing trends and needs.

